What is Net NPS and what are NPS benefits?
In this first part of the article, we will explore the essence of NPS (Net Promoter Score), its significance in the business world, how it’s calculated, and how to interpret the results. In the subsequent parts of this series, we will delve into NPS surveying, examining the process of gathering Net Promoter Scores through surveys, and explore post-survey actions and criticisms surrounding NPS survey.
What is NPS
Net Promoter Score definition
The Net Promoter Score is, a customer loyalty measure based on customer responses to the question of how likely they are to recommend a business, brand, product, service, or experience to others.
Introduced by Fred Reichheld in 2003, NPS has gained widespread acceptance across businesses of all sizes, models, industries, and countries as a primary means for monitoring and analyzing customer relationships.
A simple question with profound implications
The NPS metric derives from responses to a straightforward question posed to customers: “How likely are you to recommend our company to others on a scale of 0 to 10?” Many variations of this question exist, which we will revisit later. For now, let’s refer to this formulation as the NPS Rating Question.
Traditionally, a substantial amount of resources have been invested in complex measurements, involving costly surveys and data analysis, to gauge customer loyalty. However, the results from these efforts have often been inconclusive and haven’t demonstrated a consistent correlation with profits or growth.
In contrast, NPS has proven to be a much simpler yet more potent predictor of business volume, profits, and growth. This is primarily due to the nature of the question. Customers who recommend your products or brand are effectively putting their own reputations on the line. They will only take this risk if they have a very high level of loyalty.
The simplicity of the measurement leads to a straightforward interpretation and actionable response, as we’ll see.
Promoters, Passives and Detractors
NPS classifies customers into three categories based on their response to the NPS rating question:
- Customers responding with a rating of 9 or 10 are labeled as 'promoters.' They are highly likely to recommend your business.
- A rating of 7 or 8 represents passively satisfied customers or 'passives.' These customers will likely continue as customers but are less likely to recommend you to others.
- All other customers in the 0 to 6 range are classified as 'detractors' and are highly unlikely to recommend your business. Detractors might even voice negative opinions that deter potential customers.
It’s worth noting that there are two distinct NPS scales: the 11-point and the 5-point scales. The 5-point scale is not widely used and has inherent drawbacks, so we won’t consider it in this article.
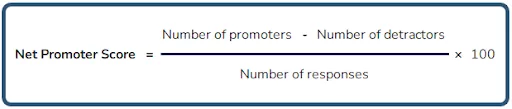
NPS Calculation
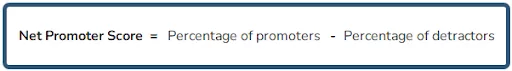
Net Promoter Score is calculated based on the count of customers falling into the Promoter and Detractor categories. The score is obtained by subtracting the percentage of Detractors from the percentage of Promoters. You can use either of the following formulas:
To demonstrate the calculation, let’s assume we conducted a survey asking the NPS rating question to our customers, and the hypothetical survey results are tabulated below:
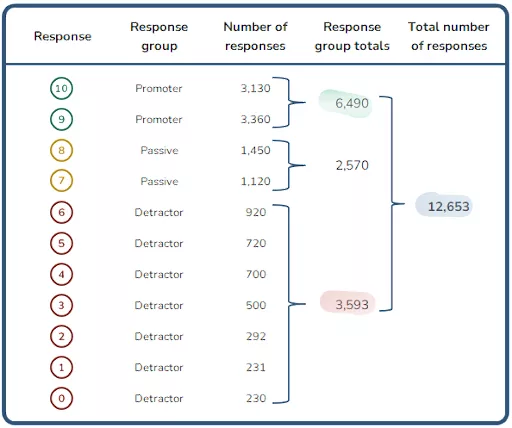
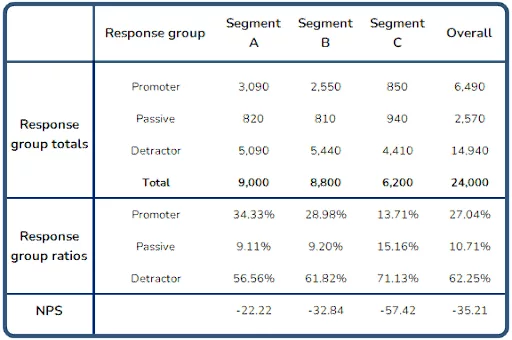
In this table, each row represents a possible customer response in the range of 0 to 10, along with the number of responses for each value. Each response belongs to a response group (Promoter, Passive, or Detractor), and the response group totals are the sum of responses within each group. The total number of responses is the sum of all response group totals.
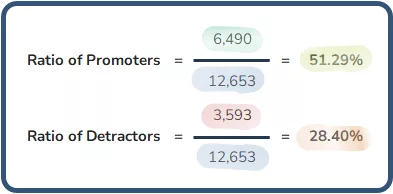
The next step involves calculating the ratios of Promoters and Detractors. The color highlights indicate where the figures originate on the “Basic Survey Results” table.
The final step is to calculate the NPS value by subtracting the Detractors’ ratio from the Promoters’ ratio:

Interpreting and analyzing NPS
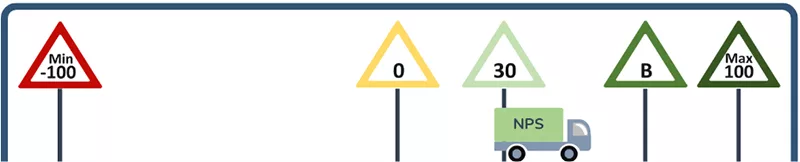
After calculating the NPS value, the next crucial step is to interpret the results. NPS falls within a range from -100 to +100. A score of 100 means everyone is a Promoter, while -100 means everyone is a Detractor. NPS is negative when Detractors exceed Promoters, positive when Promoters outnumber Detractors, and zero when Promoters and Detractors are equal.
Clearly, a positive NPS is the desired outcome, and a higher value is preferable. When analyzing your business’s trends, an increase in NPS signifies improvement, while a decrease indicates performance deterioration.
Assuming your business consistently maintains a positive Net Promoter Score, what can be inferred? As a rule of thumb, a score of 30 is considered reasonable. However, the significance of an NPS result needs to be considered within the context of your industry, sector, and business model. NPS averages can vary significantly between industries, countries, and business models, such as B2B and B2C.
For example, in the Utilities industry, a rating of 15 to 16 is typical for B2C, while Automotive and Retail NPS ratings hover around 24-25 and 32-32, respectively (again for B2C). NPS averages also vary significantly according to the business model. In banking, a range of 23 to 24 is usual for B2C, but it goes up to 45-47 for B2B.
In summary, if your NPS value is below zero, there is substantial room for improvement. Unless you are operating in a niche market with limited competition that leaves customers with few alternatives, you face the risk of the rapid erosion of your customer base.
If your NPS is zero or above, your position is relative to the NPS benchmark for your industry, country, and business model. If the benchmark exceeds your NPS, you need to catch up to retain your customers.
Around the benchmark value, you are performing at your industry average. If the sector average remains stable, this is the NPS range where your market share is likely to remain relatively constant. Being significantly above the benchmark positions your business as a market leader.
A word of caution about NPS benchmarking is necessary. Variability in industry boundaries, differences in customer characteristics across sub-segments within industries, varying perceptions of similar products, and methodological differences in data collection by different industry members mean that NPS benchmark values should only be considered as broad guides for determining your position. As important as benchmarking is, your true measure of success is the progress of NPS over time. A consistently improving Net Promoter Score is a strong indicator of a business effectively enhancing its processes in response to customer sentiment.
Segment analysis
The previous section provides a high-level measure of customer loyalty and is straightforward to calculate. However, analyzing the results by customer segment can offer more valuable insights. Let’s revisit our data with added detail.
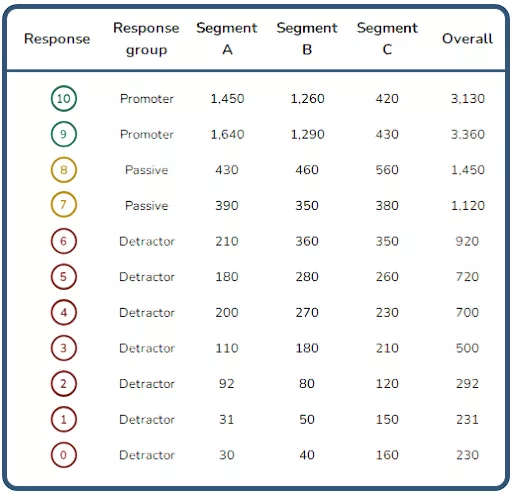
In the new table “Segmented Survey Results”, the values in the “Overall” column remain the same as the number of responses from the previous section. However, each customer’s response is now allocated to a specific segment (Segment A, B, or C). A customer segment can be any classification based on attributes like age group, gender, education, location, sector, income, preferences, or length of time as a customer.
Calculating NPS for each segment yields the results presented in the “Segment Analysis” table.
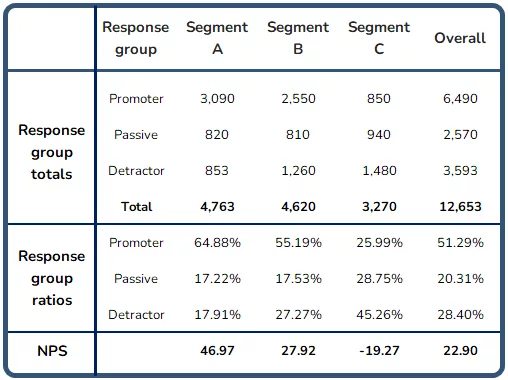
Note that the overall NPS remains the same, but the NPS values for each segment differ significantly. An immediate observation is that while the overall score is relatively positive, there are concerning issues within Segment C. So, what’s happening here?
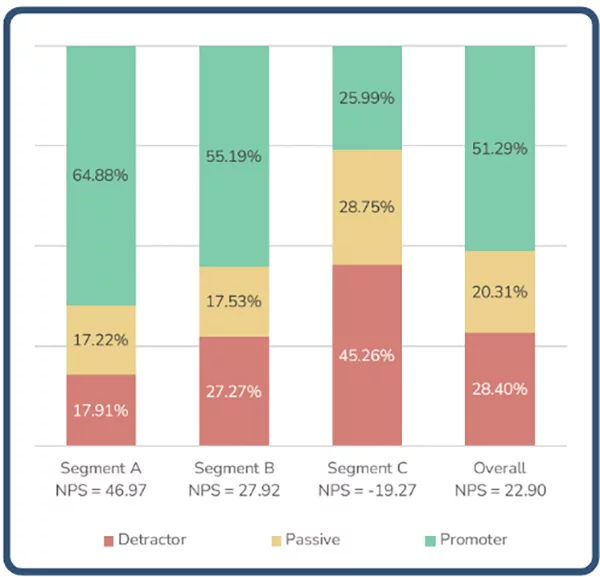
Looking at the chart “Comparative Group Distribution by Segment,” it’s evident that while Detractors and Promoters overall are 22.90% and 51.29%, respectively, the figures for Segment C are 45.26% and 25.99%. Segment B is closer to the overall value, while Segment A is significantly above. This hypothetical business clearly needs to investigate the issues with its customers in Segment C. Are their products unappealing to this demographic, or is it a cultural issue? In-depth insights can be gained through drill-down analysis into sub-segments or by examining the intersections of segments based on different customer classifications.
The specifics of your analysis will depend on how your business understands its customers and the data collected. A capable CRM tool like next4biz CRM enables you to design your system to collect the right data in a structured form that accurately reflects your business model and allows for multidimensional analysis.
The effect of bias
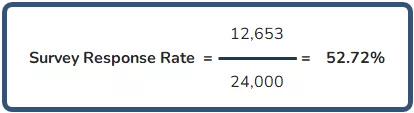
Until now, we haven’t discussed customers who received the survey but chose not to respond. The ratio of the number of respondents to the total number of people who received the survey is known as the Survey Response Rate (SRR).
In the scenario considered earlier, a total of 12,653 responders were accounted for, assuming the survey was sent to 24,000 people. SRR is calculated as follows:
SRR can vary widely. Factors such as customer demographics, engagement levels, B2C vs. B2B, survey structure, delivery channels, and incentives can all affect SRR outcomes. But does the level of SRR matter? The answer is, not much, as long as the obtained responses are uniformly representative of all customers.
Let’s introduce new information to our scenario regarding the survey, presented in the “The Impact of Non-responders with Similar Segment SRRs” table. This table lists the number of customers surveyed for each segment, and the total number of responders remains the same for each segment. The difference between surveyed and responded customers provides the count of non-responders. By calculating the segment SRR values, we can see that SRR values for segments A, B, and C are quite close, indicating a uniformly representative response from all segments.
The “Unweighted” NPS row provides the same information as previously, presenting the NPS value for the segments and overall. When each segment’s NPS is weighted by the ratio of Responders in the segment to the overall Responders, the resulting Responder-weighted NPS offers the contribution of the segment to the overall NPS. The sum of these values across all segments equals the original NPS.
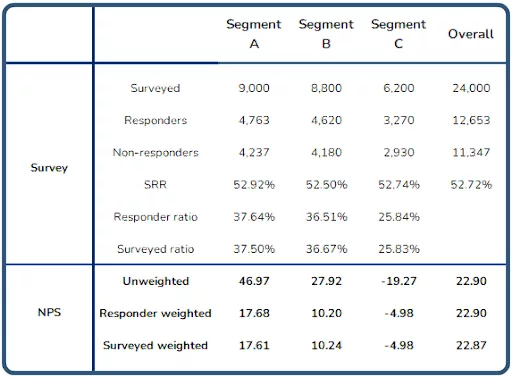
To understand the impact of including non-responders in the results, we can weigh segment NPS values with the segment’s surveyed share. The result is the Surveyed-weighted NPS row. As expected, the sum of these values closely matches the original NPS. This demonstrates that SRR does not significantly affect the results.
For comparison, in the alternative case presented in the table “The Impact of Non-responders with Dissimilar Segment SRRs”, we change one value, specifically, the Surveyed number of Segment C customers, significantly increasing it. As a result, the Surveyed-weighted NPS row looks distinct, with contributions from all segments and the overall NPS value being significantly lower. This is because of the substantial difference in SRR values between segments A and B and segment C, causing bias in the results.
Bias caused by inadequately represented surveyed customer segments is referred to as under-coverage bias, while over-representation leads to over-coverage bias. Non-response bias is another type of bias resulting from differences between respondent and non-respondent sentiments, leading to non-representative survey results.

To explore how non-response bias might influence the outcome, let’s reconsider the assumption that the distribution of non-responder sentiment is roughly the same as that of responders. An alternative approach is to add non-responders to the Detractor group, assuming that those truly satisfied with the business would have responded. This reasoning suggests that customers unwilling to respond to a survey are unlikely to promote the business to friends and associates. This assumption leads to a very different set of NPS values, all of which are in negative territory, as seen in the table “The Impact of Changing Non-Responder Distribution Assumptions.”
From the above, it’s clear that survey bias can significantly impact the quality of NPS calculation. Eliminating survey bias is not always easy, as it can stem from various sources, including structural attributes of the customer population, demographics, and survey content and execution. Different customer segments may have different communication preferences, and if surveys are not conducted through all relevant channels, it can introduce bias into the results.
Why use NPS
We have observed that NPS is simple. It is easy to understand and implement, providing a clear sense of changing customer sentiment. It is an accessible metric and a reasonably accurate predictor of growth for businesses of all types, sizes, models, sectors, and geographical locations.
NPS benchmarking offers a convenient method for comparing your performance with similar businesses. Benchmarking facilitates informed decision-making. Likewise, historical NPS data is valuable for tracking your business’s trends over time.